Complete technical documentation, guides, and API reference for Scout. Learn how to monitor, optimize, and maintain your infrastructure reliability.
Scout is an Agentic Event Intelligence System powered by Amazon Bedrock. It provides enterprise-grade monitoring, analytics, and AI-driven insights for IT operations. The platform combines real-time infrastructure monitoring with intelligent AI agents that analyze, predict, and remediate issues across your technology environment.
Monitor cloud infrastructure, applications, and network paths with the proprietary RPI Score for millisecond precision and instant alerting.
Eight specialized AI agents (The Drifter, Trender, Blender, Predictor, Situation, Prophet, Surveyor, and Agentic Workforces) deliver automated analysis.
The Oracle allows customers to create custom AI agents without coding experience through a conversational interface.
Full account management, SSO/SAML configuration, API token management, audit logging, and compliance (HIPAA, SOC 2).
portal.scoutagentics.com. Contact your administrator for login credentials or SSO configuration.Navigate to portal.scoutagentics.com in your web browser. Scout supports both standard email/password authentication and enterprise Single Sign-On (SSO) via SAML.
If your organization has SSO configured, click the SSO login option and you will be redirected to your identity provider. Otherwise, enter your email address and password to access the portal.
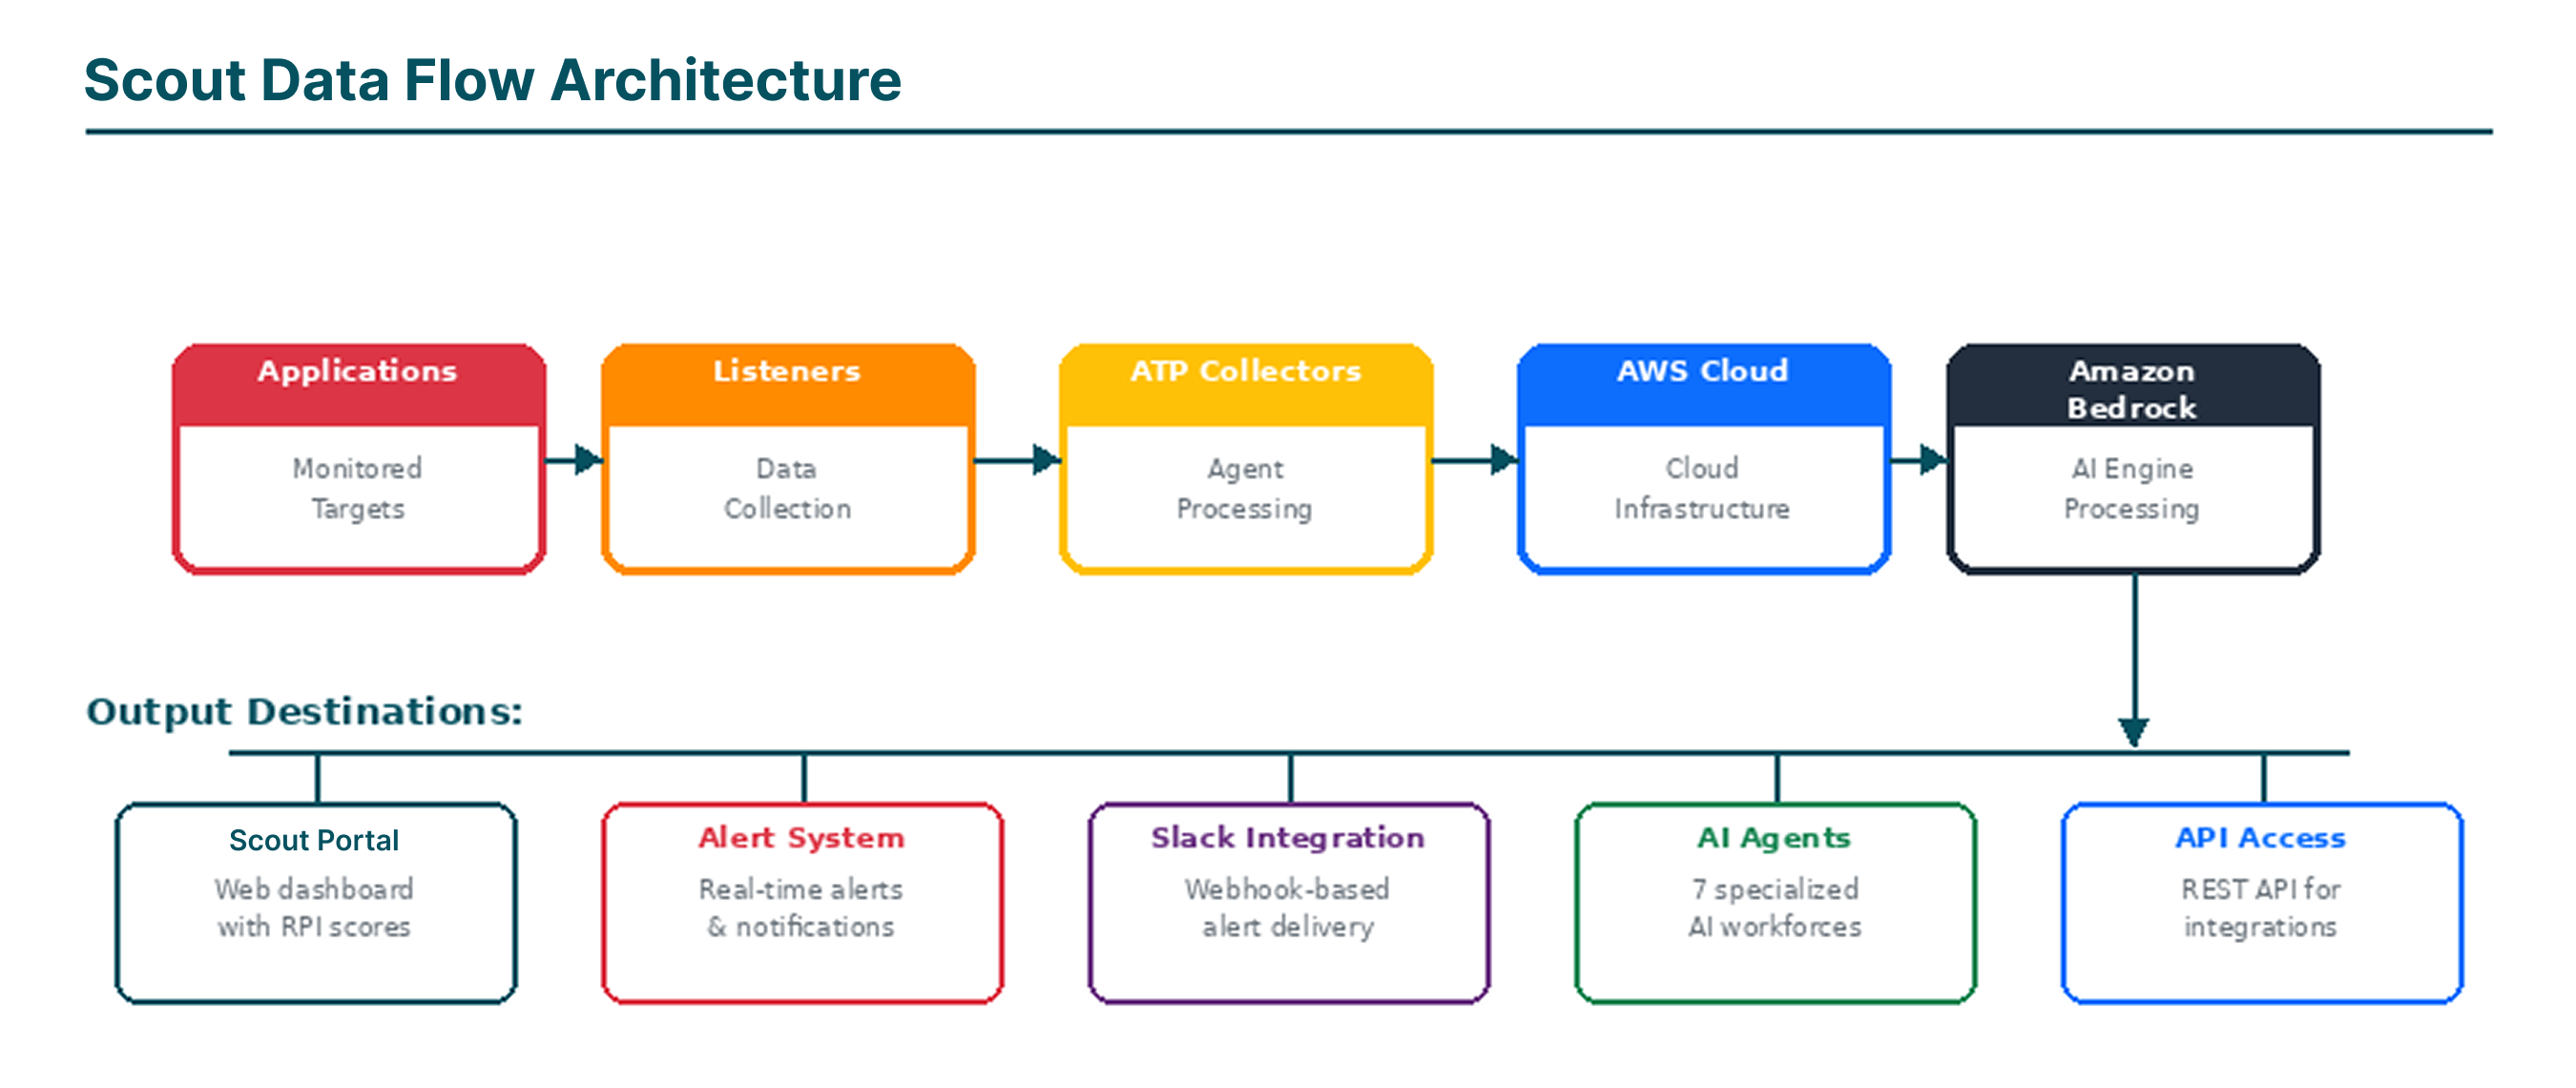 System Data Flow Architecture
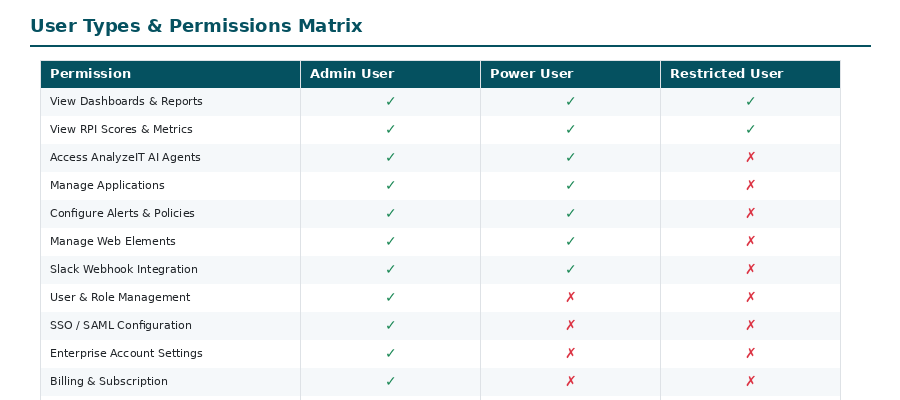 User Types and Permissions Overview
| User Type | Access Level |
|---|---|
| Admin Users | Full access to add users, adjust permissions, add applications, upgrade plan, and manage billing information. |
| Power Users | Can add applications, locations, and alerts. Cannot change user permissions, upgrade plan, or manage billing information. |
| Restricted Users | Limited view-only access to the portal. |
After logging in, you will see the main portal interface with the following elements:
New users can access a guided tour via LearnIT > Quick Tour. This activates an interactive overlay that walks you through the key features and navigation elements.
The Bishop AI assistant is available via the header bar icon. Bishop can answer questions about monitoring data, RPI scores, and help navigate the platform.
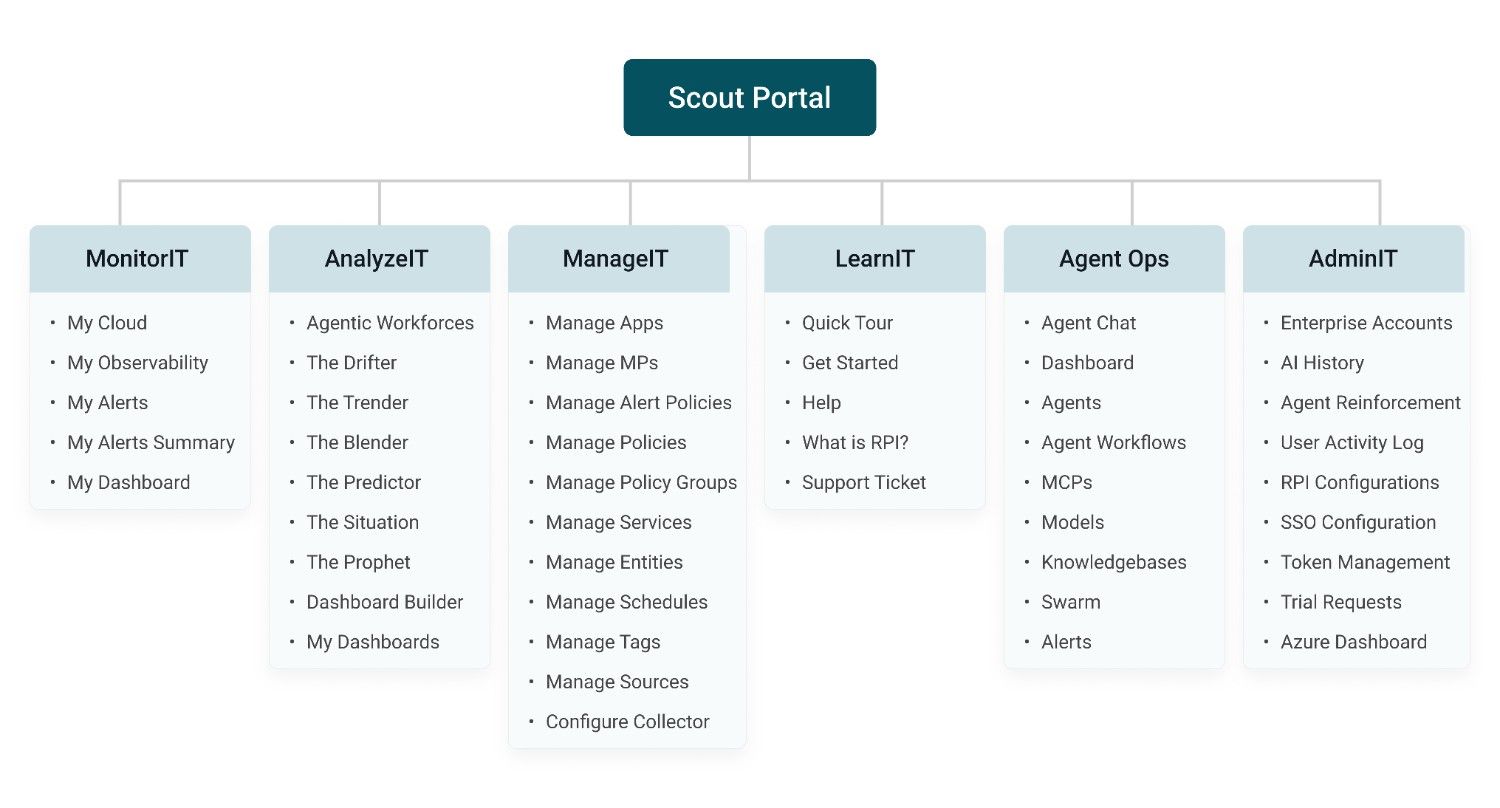 Portal Navigation Architecture
| Section | Pages | Description |
|---|---|---|
| MonitorIT | 5 pages | Infrastructure monitoring, RPI scores, alerts, and dashboards |
| AnalyzeIT | 8 pages | AI-powered analytics agents for drift, trends, correlation, prediction, and custom intelligence |
| ManageIT | 11 pages | Application, service, entity, policy, and data source management |
| ModernizeIT | 2 pages | Application portfolio modernization tracking |
| LearnIT | 5 pages | Guided tour, help documentation, RPI reference, and support tickets |
| AGI | 11 pages | AI agent management, testing, knowledge bases, and model configuration |
| AdminIT | 8 pages | Enterprise accounts, SSO, tokens, error logs, and user activity |
Additional header features include the Bishop AI assistant (accessible via the header icon), a light/dark mode toggle, and user profile management.
MonitorIT is the primary monitoring hub, providing real-time visibility into your cloud infrastructure, application performance, and alert management. All monitoring data feeds into the proprietary RPI Score system for unified health assessment.
Comprehensive view of your cloud infrastructure monitoring with status and key performance indicators.
Central dashboard for RPI Score monitoring, performance metrics, and historical comparisons.
Central alert management console for viewing, acknowledging, and managing alerts across all resources.
Customizable dashboard views where you can create personalized monitoring layouts.
The My Cloud page provides a comprehensive view of your cloud infrastructure monitoring. It displays monitored cloud resources, their status, and key performance indicators.
My Observability is the central dashboard for RPI Score monitoring and performance metrics.
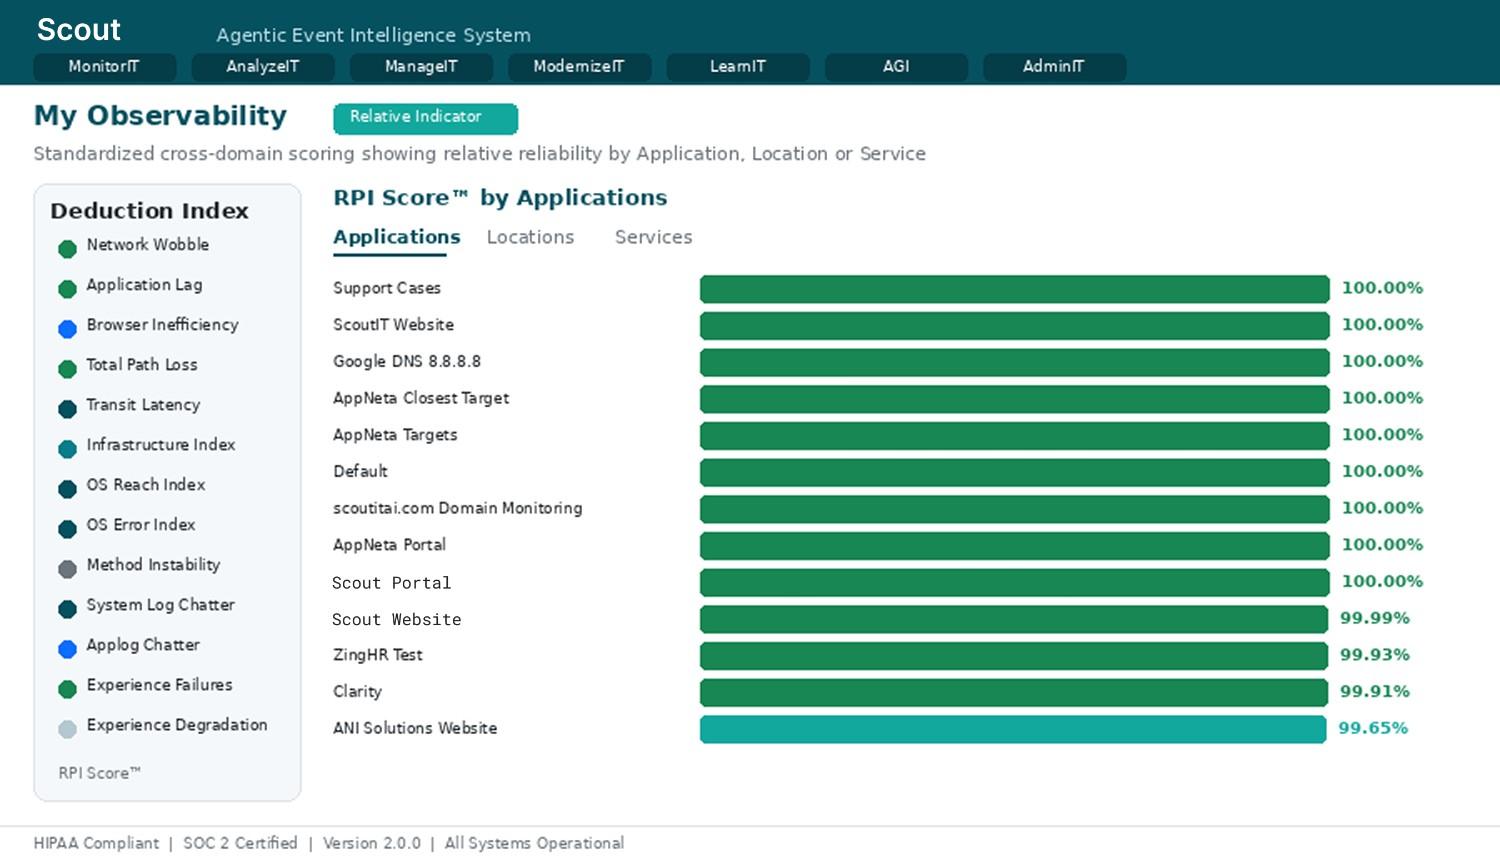 My Observability Dashboard
The My Alerts page is your central alert management console. It displays active alerts across all monitored resources, allowing you to view, acknowledge, and manage alerts.
My Alerts Summary provides an aggregated overview of alert trends and patterns. Use this view for operational reporting and trend analysis.
My Dashboard provides customizable dashboard views where you can create personalized monitoring layouts.
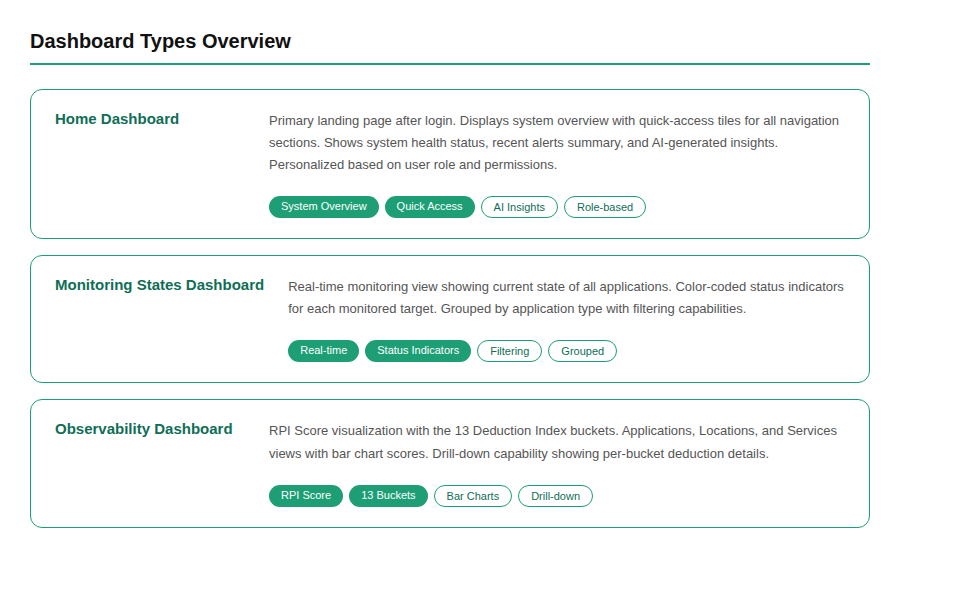 Dashboard Types Overview
AnalyzeIT houses Scout's suite of AI-powered analytics agents. Each agent is a specialized AI system designed to analyze specific aspects of your IT environment. These agents leverage Amazon Bedrock foundation models to deliver intelligent, automated analysis.
Configuration Drift Detection — Continuously monitors for configuration changes that deviate from established baselines.
Agent of Pattern Recognition — Employs Lean Six Sigma DMAIC methodology with EMA and Kaufman 50-Day Adaptive Moving Average algorithms.
Six Sigma Correlation Agent — Performs multi-source correlation analysis using Six Sigma statistical methods including Pareto analysis.
RPI Improvement Oracle — Uses Monte Carlo simulations (up to 100,000 iterations) with 30-day moving average analysis.
Custom DX-O₂ Situation Builder — Specialized agent for Broadcom DX-O₂ alarm analysis and root cause correlation.
Network Forecaster — Live network path analysis and forecasting using the Path Prophecy tool.
Agent of Custom Intelligence — AI-powered visualization engine that accepts natural language prompts and generates custom widgets.
Unified command center with three-column layout: RPI Scores, Workforce Agents, and Workforce Responses.
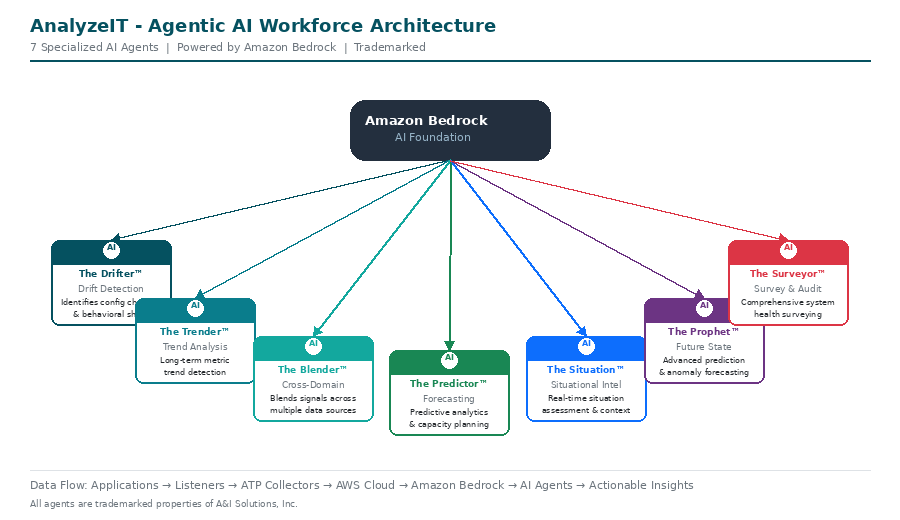 Agentic Workforces Architecture
Unified command center with three-column layout:
Continuously monitors for configuration changes that deviate from established baselines. Analyzes RPI score drift across applications and locations with application and location selector filters.
Employs Lean Six Sigma DMAIC methodology with Exponential Moving Average (EMA) and Kaufman 50-Day Adaptive Moving Average algorithms to detect meaningful trends while filtering out noise.
Performs multi-source correlation analysis using Six Sigma statistical methods including Pareto analysis. Supports both predefined analysis questions and custom natural language queries.
Uses Monte Carlo simulations (up to 100,000 iterations) with 30-day moving average analysis to forecast RPI score improvements and enable data-driven capacity planning.
Specialized agent for Broadcom DX-O₂ alarm analysis. Correlates alarms from Broadcom's DX Operational Observability platform for faster root cause analysis.
Live network path analysis and forecasting using the Path Prophecy tool. Predicts potential issues before they affect end-user experience.
AI-powered visualization engine that accepts natural language prompts and generates custom widgets, charts, and data visualizations on demand.
ManageIT provides comprehensive configuration management for all monitored resources.
| Page | Description |
|---|---|
| Manage Apps | Application grid with card, list, and catalog views. Add, edit, or remove applications. |
| Manage MPs | Management Packs — configuration templates for monitoring rules. |
| Manage Alert Policies | Alert Group Policies defining rules and thresholds. |
| Manage Policies | AppNeta monitoring policy configuration displayed as cards. |
| Manage Policy Groups | Organize related monitoring policies in hierarchical groups. |
| Manage Services | Logical groupings of monitored resources as cards. |
| Manage Entities | View all entity collections — fundamental monitored objects. |
| Manage Schedules | Daily, weekly, and custom scheduling patterns. |
| Manage Tags | Flexible labeling system with “Applied On” associations. |
| Manage Sources | Data source integrations: AppNeta, AWS, O2 (Broadcom DX). |
| Configure Collector | Generic data collector agent with Client ID, Display Name, Location, and Account Registration Token. |
Displays all registered applications as a grid of cards. Add, edit, or remove applications from monitoring.
The Manage Apps page supports three view modes: App Tile View (card-based grid), App List View (tabular list), and App Catalog (preloaded applications for quick setup).
Scout uses Selenium scripting language for Experience monitoring.
The Authentication section is only visible for catalog apps. Enter valid credentials (validates the site is active). Use “Show Advance Setting” to modify Web Elements. Scout supports HTML elements only. Use “Test AutoLogin” to validate — success reads “Login test successful.”
Management Packs (MPs) are configuration templates that define monitoring rules for specific technologies.
Alert policies define the rules and thresholds that trigger alerts. Displays all configured Alert Group Policies (AGPs).
Handles AppNeta monitoring policy configuration displayed as cards.
Organize related monitoring policies together in hierarchical groups.
Configured services as cards representing logical groupings of monitored resources.
View all entity collections — the fundamental monitored objects within Scout.
Configure monitoring schedules with daily, weekly, and custom scheduling patterns.
Flexible labeling system for organizing monitored resources with “Applied On” associations.
Data source integrations: AppNeta, AWS, O2 (Broadcom DX). Includes Source Catalog, Manage APIs, and Manage Workflow.
Setup for the generic data collector agent with Client ID, Display Name, Location, and Account Registration Token.
Tools for tracking and managing application modernization initiatives, including legacy-to-modern technology migrations.
Portfolio summary with KPI cards and applications overview table.
Individual modernization project cards showing source technology, target technology (e.g., COBOL to Java), migration status, and key project details.
LearnIT is the portal's learning and support hub, providing guided tours, documentation, RPI Score reference information, and support ticket management.
Interactive tutorial overlay that guides new users through key features and navigation. Recommended for all new users.
Three setup cards walk you through initial configuration: connect data sources, configure monitoring, and set up dashboards.
Three top-level sections: Getting Started (User Guide + Account Guide), Support (live chat), and FAQs (four categories).
Comprehensive infographic explaining the RPI Score. See the RPI Score Reference section for the detailed breakdown of all 13 deduction buckets.
Submit new support requests and track existing issues via the Support Ticket History table.
Live chat access with the Scout support team.
Comprehensive management of Scout's AI agent infrastructure: monitoring performance, creating custom agents, managing knowledge bases, configuring models, and testing behavior.
| Page | Description |
|---|---|
| AI Dashboard | Real-time AI agent monitoring with KPI cards (Average Latency, Total Requests, Error Rate, Active AI Agents). |
| Agentics | Manages all AI agents with Bedrock Agents and Oracle Agents tabs. Grid/list view, search, Create New Agent. |
| The Oracle™ | No-code agent builder through a conversational interface. Includes custom avatar selection. |
| Agent Metrics | Detailed performance analytics: Agent Name, Metric Name, Metric Value. |
| Agent Alerts | Alerts triggered by performance thresholds with Create Alarm feature. |
| Alerts Configuration | Manages alarm rules: agent/model, alarm name, condition type, threshold value. |
| Agent Logs | Detailed activity logs with expandable JSON rows and pagination. |
| AGI History | Complete audit trail: Agent Name, Input Question, Response, Response Time. |
| Test Agent | Sandbox for testing agent behavior with chat interface. |
| Knowledgebase | Knowledge repository cards: name, ID, status, dates, description. |
| Model Configuration | Foundation model management: Anthropic (Claude), Meta (Llama), Amazon (Nova). |
Scout Monitor — Real-time AI agent monitoring dashboard
| KPI | Description |
|---|---|
| Average Latency | Mean response time across all active agents |
| Total Requests | Cumulative number of agent invocations |
| Error Rate | Percentage of failed agent requests with health indicator |
| Active AI Agents | Count of active vs. total agents, with inactive agent warnings |
Below the KPI cards, the Model Performance Comparison section displays individual agent performance cards with status, TTFT, Token Ratio, Total Time, and Efficiency Score.
Agentic Creator of Custom Agents
No-code agent builder through a conversational interface. Describe your agent idea in the chat, and The Oracle guides you through defining purpose, capabilities, and configuration. Includes custom avatar selection.
Manages all AI agents with two tabs: Bedrock Agents (Amazon Bedrock agents with name, ID, status, model ARN, AI2 Score) and Oracle Agents (custom agents from The Oracle builder). Supports grid/list view, search, and Create New Agent.
Detailed performance analytics: Agent Name, Metric Name, Metric Value. Searchable and filterable.
Alerts triggered by performance thresholds: Agent Name, Alarm Name, State, Metric, Description, Threshold, State Reason, Last Updated, Actions. Use Create Alarm for new conditions.
Manages alarm rules: agent/model, alarm name, condition type (e.g., GreaterThanThreshold), threshold value. Alarms can be edited, disabled, or deleted.
Detailed activity logs: Agent Name, Timestamp, Message payload (JSON). Expandable rows and paginated.
Complete audit trail: Agent Name, Input Question, Response, Response Time, Created timestamp.
Sandbox for testing agent behavior with a chat interface. Validate responses before production deployment.
Knowledge repository cards: name, ID, status, dates, description. Use Create Knowledge Base to add repositories.
Foundation model management. Supports Anthropic (Claude), Meta (Llama), and Amazon (Nova). Use Create New Model to register additional models.
System administration capabilities for enterprise accounts, security configuration, audit logging, and platform settings. Restricted to administrator-level users.
| Page | Description |
|---|---|
| Enterprise Accounts | Manages all customer accounts: Account Version, Company Name, Account ID, Plan Name, Email, contact info, enable/disable toggle. |
| Error Logs | Searchable table: API URL, HTTP Code, HTTP Status, API Response body, AppNeta Org. ID, Error Occurred On. |
| AI History | Audit log of AI interactions: User Question, AI Answer, Date Created, Response Time, Critic Level. |
| Agent Reinforcement | Agent learning and improvement. Two tabs: Daily Remediations and History. |
| User Activity Log | Tracks all user actions with user selector dropdown. |
| RPI Configurations | Customize RPI Score settings per account. |
| SSO Configuration | SAML 2.0 Single Sign-On setup. |
| Token Management | API access token administration. |
SAML 2.0 Single Sign-On configuration:
| Field | Description |
|---|---|
| SSO Enabled | Toggle to enable/disable SSO. |
| Issuer | SAML identity provider issuer URL. |
| Login URL | SAML identity provider login endpoint. |
| Entity ID | Unique service provider identifier. |
| ACS URL | Assertion Consumer Service URL (api.scoutagentics.com/api/auth/acs). |
| IdP Certificate | Identity provider's X.509 signing certificate. |
| Logout URL | Optional logout redirect URL. |
| Map Attributes | SAML attribute mappings. |
Use Test SAML Login to validate configuration before enabling.
API access token administration: Account Name, Description, Status, Created, Expiration, Last Used, Actions. Use Create Token for new tokens.
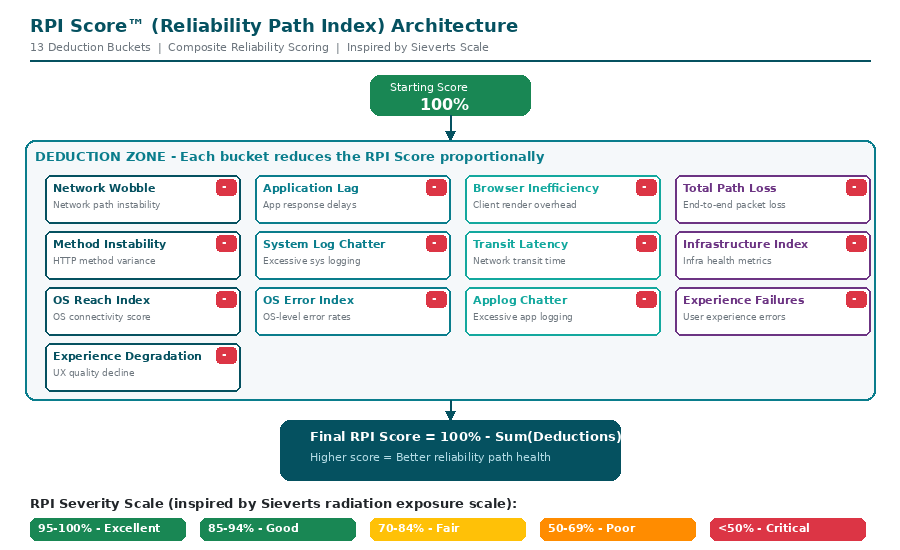 RPI Score Architecture
The Reliability Path Index (RPI) Score is Scout's proprietary metric using a thirteen-bucket reliability model that quantifies risk using a unique scale inspired by radiation exposure (Sieverts), with lower values indicating higher resilience.
| # | Bucket | Description |
|---|---|---|
| 1 | Network Wobble | Measures network stability and jitter. Tracks packet loss, latency variance, and path inconsistencies. |
| 2 | Application Lag | Tracks application response delays and processing bottlenecks. |
| 3 | Browser Inefficiency | Measures client-side performance issues. Tracks DOM rendering delays, JavaScript execution time. |
| 4 | Total Path Loss | Quantifies end-to-end transaction failures. Monitors dropped connections and lost data packets. |
| 5 | Method Instability | Tracks API and method-level reliability issues. Monitors function call failures. |
| 6 | System Log Chatter | Measures abnormal system logging activity. Tracks excessive log generation and warning spikes. |
| 7 | Transit Latency | Quantifies end-to-end network delays across network hops and geographic distances. |
| 8 | Infrastructure Index | Measures overall infrastructure health. Tracks hardware reliability and virtualization efficiency. |
| 9 | OS Reach Index | Monitors operating system accessibility and reachability. |
| 10 | OS Error Index | Captures OS-level errors and exceptions. Monitors kernel errors and system crashes. |
| 11 | Applog Chatter | Monitors application log volume and anomalies. |
| 12 | Experience Failures | Captures user-facing errors and degraded experiences. |
| 13 | Experience Degradation | Aggregates alerts and incidents across multiple domains. |
The Reliability Path Index© begins at 100 points; each bucket is evaluated in real-time and points are deducted proportionally when thresholds are exceeded. Moving averages (10-day, 30-day, 50-day, 100-day) are used by AI agents to identify trends and forecast changes.
User Types and Permissions| User Type | Access Level |
|---|---|
| Admin Users | Full access to add users, adjust permissions, add applications, upgrade plan, and manage billing information. |
| Power Users | Can add applications, locations, and alerts. Cannot change user permissions, upgrade plan, or manage billing information. |
| Restricted Users | Limited view-only access to the portal. |
Portal Navigation Architecture| Section | Pages | Description |
|---|---|---|
| MonitorIT | 5 | Infrastructure monitoring, RPI scores, alerts, and dashboards |
| AnalyzeIT | 8 | AI-powered analytics agents |
| ManageIT | 11 | Application, service, entity, policy, and data source management |
| ModernizeIT | 2 | Application portfolio modernization tracking |
| LearnIT | 5 | Guided tour, help documentation, RPI reference, and support tickets |
| AGI | 11 | AI agent management, testing, knowledge bases, and model configuration |
| AdminIT | 8 | Enterprise accounts, SSO, tokens, error logs, and user activity |
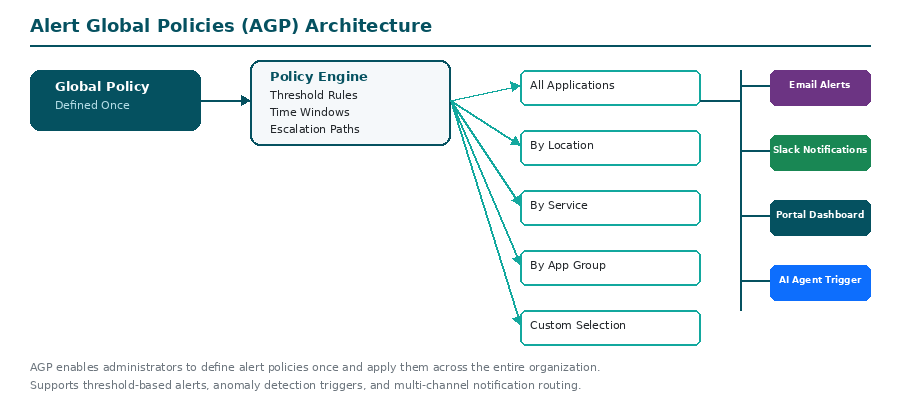 Alert Global Policies Architecture
Scout supports Slack webhook integration for alert notifications.
Create a dedicated Slack channel for receiving Scout webhook messages.
Go to https://api.slack.com/apps and log in. Click “Create New App” then “From scratch.” Name the app and select the correct workspace.
Click “Incoming Webhooks” in the app settings. Turn on Incoming Webhooks. Click “Add new Webhook to Workspace.” Select the channel and click “Allow.”
Copy the Webhook URL and paste it into the Scout alert notification configuration to enable Slack notifications.
When configuring custom application monitoring, you may need to identify web elements for login automation.
| Locator Type | Description |
|---|---|
| ID Locator | Uses the “id” attribute (best choice). Warning: long number IDs are typically dynamic. |
| Name Locator | Uses the “name” attribute. Syntax: name="element-name". |
| Class Locator | Uses the “class” attribute. Pick the unique class value. |
| Element | Input Type |
|---|---|
| Buttons | Click |
| Hyperlinks | Click |
| Text boxes | Text |
Frequently asked questions organized into four categories.
1) Affordable cloud intelligence, 2) Executive Dashboard & Analytics, 3) Fast Setup, 4) Critical Cloud Monitoring, 5) Unified Observability, 6) SLA Protection.
Yes, with Scout's enterprise pack.
Upgrade your subscription at any time. Navigate to the Manage Account screen and enter the number of additional virtual monitoring points.
Upgrade your subscription at any time. Navigate to the Manage Account screen and enter the number of additional hardware monitoring points.
Red indicates the application or location is not active. Green indicates it is active.
You should see results on the Monitoring States screen five minutes after adding an application.
Latency and data loss for measured applications are used as KPIs to indicate performance.
A proprietary scoring formula calculated in real time to show how resilient a service is.
Yes, according to your number of users agreement with A&I.
Yes, the enterprise pack allows users to integrate their own monitoring data and include it in the reliability score.
No. Scout uses both active and passive network monitoring to create synthetic traffic, marrying network performance with application performance in real time.
Create an Alert Global Policy with monitoring types (Data Loss, Data Jitter, Latency), set caution and danger thresholds, and set email recipients.
Yes, synthetic monitoring follows network paths just like your users do.
Synthetic/active monitoring provides visibility into any network or web application your users can reach.
Yes, hardware options support Wi-Fi monitoring. Virtual monitoring points do not.
Yes, synthetic monitoring traverses experiences and emulates end-user interactions across all networks, clouds, and systems.
Mean Time to Resolution / Mean Time to Innocence. Scout reduces troubleshooting from days/hours to minutes.
Extremely lightweight with minimal network load.
Yes, the enterprise pack enables ServiceNow integration and monitoring.
Observability consultants use Scout with the reliability score to improve overall observability.
Yes, upgrade options enable custom path monitoring.
Currently users cannot write scripts directly. Scout generates scripts based on web elements.
Click ManageIT > Manage Apps, click the + (plus) button, and add the app details.
Admin Users (full access), Power Users (apps/alerts but not billing/permissions), Restricted Users (view-only).
No, email addresses cannot be updated.
Contact support@scoutitai.com.
Contact support@scoutitai.com directly.
Contact support@scoutitai.com directly.
| Term | Definition |
|---|---|
| AGI | Artificial General Intelligence — Scout's AI agent management section |
| ACS URL | Assertion Consumer Service URL — SAML endpoint for SSO authentication |
| AGP | Alert Global Policy — Defines alerting rules for monitored resources |
| AI2 Score | Agent Intelligence Index — Performance and accuracy rating for AI agents |
| Bishop | Scout's built-in AI assistant accessible from the header |
| DMAIC | Define, Measure, Analyze, Improve, Control — Lean Six Sigma methodology |
| DX-O₂ | Broadcom DX Operational Observability platform |
| EMA | Exponential Moving Average — Statistical technique for trend analysis |
| IdP | Identity Provider — External authentication service for SSO |
| MP | Management Pack — Configuration template for monitoring rules |
| MTTI | Mean Time to Innocence — Time to isolate root cause and clear components |
| MTTR | Mean Time to Resolution — Average time to resolve an incident |
| RPI Score | Reliability Path Index — 13-bucket proprietary performance metric (Patent Pending) |
| SAML | Security Assertion Markup Language — Standard for SSO authentication |
| TTFT | Time to First Token — AI model response latency measurement |
| Section | Page | URL Path |
|---|---|---|
| MonitorIT | My Cloud | /home/monitorit/my-cloud |
| MonitorIT | My Observability | /home/monitorit/my-observability |
| MonitorIT | My Alerts | /home/monitorit/my-alerts |
| MonitorIT | My Alerts Summary | /home/monitorit/my-alerts-summary |
| MonitorIT | My Dashboard | /home/monitorit/my-dashboard |
| AnalyzeIT | Agentic Workforces | /home/analyzeIT/agentic-workforces |
| AnalyzeIT | The Drifter | /home/analyzeIT/drifter |
| AnalyzeIT | The Trender | /home/analyzeIT/trender |
| AnalyzeIT | The Blender | /home/analyzeIT/blender |
| AnalyzeIT | The Predictor | /home/analyzeIT/predictor |
| AnalyzeIT | The Situation | /home/analyzeIT/situation |
| AnalyzeIT | The Prophet | /home/analyzeIT/prophet |
| AnalyzeIT | The Surveyor | /home/analyzeIT/surveyor |
| ManageIT | Manage Apps | /home/manageit/manage-apps |
| ManageIT | Manage MPs | /home/manageit/manage-mps |
| ManageIT | Manage Alert Policies | /home/manageit/manage-alert-policies |
| ManageIT | Manage Policies | /home/manageit/manage-policies |
| ManageIT | Manage Policy Groups | /home/manageit/manage-policy-groups |
| ManageIT | Manage Services | /home/manageit/manage-services |
| ManageIT | Manage Entities | /home/manageit/manage-entities |
| ManageIT | Manage Schedules | /home/manageit/manage-schedules |
| ManageIT | Manage Tags | /home/manageit/manage-tags |
| ManageIT | Manage Sources | /home/manageit/manage-sources |
| ManageIT | Configure Collector | /home/manageit/configure-collector |
| ModernizeIT | Dashboard | /home/modernizeIT/dashboard |
| ModernizeIT | Application Portfolio | /home/modernizeIT/application-portfolio |
| LearnIT | Quick Tour | (tutorial overlay) |
| LearnIT | Get Started | /home/learnIT/get-started |
| LearnIT | Help | /home/learnIT/help |
| LearnIT | What is RPI? | /home/learnIT/what-is-rpi |
| LearnIT | Support Ticket | /home/learnIT/support-ticket |
| AGI | AI Dashboard | /home/agi/ai-dashboard |
| AGI | Agentics | /home/agi/agentics |
| AGI | The Oracle | /home/agi/the-oracle |
| AGI | Agent Metrics | /home/agi/agent-metrics |
| AGI | Agent Alerts | /home/agi/agent-alerts |
| AGI | Alerts Configuration | /home/agi/agent-alerts/custom |
| AGI | Agent Logs | /home/agi/agent-logs |
| AGI | AGI History | /home/agi/agi-history |
| AGI | Test Agent | /home/agi/test-agent |
| AGI | Knowledgebase | /home/agi/knowledge-bases |
| AGI | Model Configuration | /home/agi/model-configuration |
| AdminIT | Enterprise Accounts | /home/adminit/enterprise |
| AdminIT | Error Logs | /home/adminit/errorlogs |
| AdminIT | AI History | /home/adminit/ai-history |
| AdminIT | Agent Reinforcement | /home/adminit/agent-reinforcement |
| AdminIT | User Activity Log | /home/adminit/user-activity-log |
| AdminIT | RPI Configurations | /home/adminit/rpi-settings |
| AdminIT | SSO Configuration | /home/adminit/sso-configuration |
| AdminIT | Token Management | /home/adminit/token-management |
| Version | Date | Changes |
|---|---|---|
| V1.2.3 | 9/04/2024 | Quick Tour, Fixed #920 Manage App validation, Added Release Note page |
| V1.2.2 | 8/04/2024 | Policy agreement popup, support ticket list, login terms/privacy URLs, Prophet for AnalyzeIT |
| V1.2.1 | 04/04/2024 | Hotfix for footer & enterprise account, CSS cleanup, timer fix |
| V1.2.0 | 28/03/2024 | Login success message update, Prophet UI, predictor history, timer fix |
| V1.1.0 | 27/03/2024 | Trender and Blender functionality, ManageIT access fix for trial/standard plan |
| V1.0.0 | 26/03/2024 | User Onboarding, Profile Settings, Universal, ManageIT, AdminIT, MonitorIT, Plan Access, LearnIT |
For additional support, access the portal at portal.scoutagentics.com and navigate to LearnIT > Support Ticket.
portal.scoutagentics.com
trust.anisolutions.com
anisolutions.com/about/legal/IP
support@scoutagentics.com
Stay informed with our latest insights and updates plus industry trends—subscribe to our newsletter today!


2025 Scout-US66890549 Patent Pending

 No credit card required
